Disciplined Entrepreneurship
- 1. Who is Your Customer?
- 2. What Can You Do for Your Customer?
- 3. How Does Your Customer Acquire Your Product?
- 4. How Do You Make Money off Your Product?
- 5. How Do You Design and Build Your Product?
- 6. How Do You Scale Your Business?
Disciplined Entrepreneurship Is a Systematic and Rigorous 24-step Framework to Build New Innovation-Based Ventures.
1. Who is Your Customer?
1.1. Market Segmentation
The single necessary and sufficient condition for a business is a paying customer. The process starts not by focusing on the idea, but on who will be the end user. Therefore, you will focus on the customer and build the company from the endpoint, rather than trying to push out on the customer what we think they need. This is the first in a series of steps which will help you define, test and understand who your customer is.
In this first step, two things are critical:
- See the world through the eyes of your customer. Just because you want something, doesn’t mean everybody else does or that they want it in the same way. What you want is not important. Did you start your company with the solution as the center of it—with customers rotating around it? Invert that. See the customer as the hub and the solution rotating around them.
- Open up your mind. Brainstorm all potential customers. Who can use your idea or technology? Let a thousand flowers bloom at this point—and stop and smell every one of them! Be careful to make distinct market segments that are not so broad as to be meaningless. For instance, Market segment: consumers, tells you absolutely nothing. But, Market segment: 24–30 year old male, who is online and makes over $75K per year, lives in urban environment, tells you something very specific about your customer.
Choose Market Approach
Do you serve only one type of “customer”, or will you serve multiple customers in order to create value? Will your “end-user customer” be different from the “economic-buyer customer”, or do you need both a “buyer” and a “seller”, like eBay, to make your idea work?. Don’t confuse types with segments—a customer type has a very specific need (e.g. hosting for their website), while a segment is a specific group of customers who have that need (e.g. bloggers, SMEs etc.):
- Single-sided market means that you only serve one customer segment only.
- Two-sided market means that you serve two complementary types of customers.
- Multi-sided market is a more complex approach, involving three or more types of customers.
B2B (business-to-business) serves other businesses in various industries, while B2C (business-to-consumer) creates products or services which help individual consumers solve personal needs or problems. For multi-sided markets, focus on the primary (end user—i.e., the one who generates value) customer.
- B2C (business-to-consumer).
- B2B (business-to-business).
- Both (or more complex models).
Brainstorm Market Opportunities
Do primary market research by talking to at least 50 people about your idea and the problem it solves. Then sit down with your team and list all possible customer types. Do you think you have a crazy idea and it won’t work? List it anyway, because it opens the aperture and expands the boundary conditions, and close to these boundary conditions may be where some of the most interesting markets will be for you. Open the windows and let as much sun and fresh air in as you possibly can.
- Get out of the building and talk to people.
- Brainstorm with your team and list ideas about possible types of customers.
- Segment these customers based on industry, geographic location, income, user types, and other criteria.
- List at least 15 potential market segments.
Narrow down Market Opportunities
Ask the following questions in order to narrow down to the most promising 6-12 segments—but you only need to answer these in general now, to tightly focus your market segments. You will do more research later.
For each segment, evaluate the following aspects:
- purchasing power;
- ease of direct access to it;
- if each has a compelling reason to buy;
- whether you can deliver a full product (with or without partners);
- whether there is entrenched competition;
- whether you can leverage success to expand into other markets if you win this one;
- whether segment is compatible with values/passion and goals of funding team.
Research In-depth Your Primary Market
Dig for more data on each segment, and analyze the following:
- End users: who are they, specifically?
- Application: what will they be using your product for?
- Benefits: what actual value do they gain?
- Lead customers: the most influential.
- Market characteristics: what will ease or hinder adoption of the new technology?
- Partners and players: who do you need in order to deliver value to the customer?
- Market size: how many customers is 100% of the market?
- Competition: who else tries to solve the same need or problem?
- Complementary assets required: what else does the customer need to get a full solution to his problems or needs?
List 5–10 Possible Customer Segments
After going through all the tasks above, you should have brainstormed a number of potential market segments for your idea without choosing one (you will do that later).
In doing this exercise with your team, you will have started to get yourself and your team in the right mindset—let’s build this company with the customer at the forefront of our minds. You will also have started the important process of doing primary market research. As you go forward, this will be a crucial skill employed many times by your team. Remember, you need to do market research in inquiry mode, not advocacy mode. You are not yet selling. You are investigating and learning what should be done. Don’t jump the gun.
In the Findings tab, write down the list of market segments to further pursue. Add enough detail for each segment to be meaningful.
Young professionals (25-35) in Western Europe, heavy smartphone users, who are unsatisfied with the conservative and limited features of traditional banks, and want instant, fast and flexible access to all their money, credit cards or investments.
List all the segments in a similar manner.
1.2. Select a Beachhead Market
Selecting your beachhead market is critical for narrowing focus and attention to only one area of attack. Entrepreneurs have limited resources and must be very careful how these are deployed.
To have maximum impact, put all resources into one market and deselect the other markets for now. This is sometimes called “putting all the wood behind the arrow”. This concept is well described as well in Geoffrey Moore’s class “Crossing the Chasm” book. Especially for first-time entrepreneurs, who find it very difficult to ignore market opportunities, and who are hoping that chasing more markets will lead to one taking off sooner or later, the process of focusing on one to the exclusions of others is very painful. Suck it up and do it. Strongly focus on one and the others will come later.
Focusing now on more than one segment = Increasing odds of failure.
Focusing now on one segment = Increasing odds of success
Choosing a Beachhead Market
Use the criteria below to narrow your market opportunities and to select a beachhead market. Ask these questions for each market segment that you’ve identified in Step 1. Note, there is every likelihood of more than one market you could be successful in immediately, so don’t feel there is one singular right answer. Pick one and move on! Deciding whether or not there is one right answer (fear of being wrong) gets you stuck in “analysis paralysis” instead of getting you involved in the primary goal: testing beliefs through action and primarymarket research.
In fact, it is critical that the dominant fraction of the data you get to make this (and the other decisions) comes from primary market research. The answer resides with the data from the direct interaction with real potential customers and not by debates that you have in your office free of primary market research data analysis. Remember too, that as much as you might love your idea, you are in inquiry mode and not advocacy (i.e., selling) mode now.
Also note that if you make an educated guess on a beachhead market and you then invalidate it, that could be a good thing, because now you can focus on the other options and not look back again at the first market.
Lively team discussions will help you select your best beachhead market (first market) to approach. Discuss these:
- Is the target customer well-funded?
- Can your sales force readily access the target customer?
- Does the target customer have a compelling reason to buy?
- Can you today, with the help of partners, deliver a whole product? – i.e., a 100% of the solution?
- Is there real or perceived entrenched competition (from the target customer’s perspective) that could block you?
- If you win this segment, can you leverage it to enter additional segments?
- Is this market consistent with the values, passions and goals of your founding team?
Is Your Market Targeted Enough?
In order to be able to focus and successfully chase the opportunity, you have to make sure that the market is well-targeted. If the market is not homogenous, segment it further, until you can focus on a segment which fits all the criteria below.
- The customers within the market all buy similar products.
- The customers within the market have a similar sales process. They also expect products to provide value in similar ways and they are sold in a similar manner. For instance, they have a similar value proposition and persona.
- There is “word of mouth” between customers in the market, which can serve as compelling reference to other customers.
1.3. Build an End User Profile
In this step you will get to a detailed description of the typical end-user within your beachhead market segment. This will be a composite of your end-user customer. Your end-user customer may also be the economic buyer—customer meaning that they pay you for your product—or they might not be.
However, focus first on the end-user customer because without them embracing the product, there is no value generated for which we can extract rent—either from that end user or from a third party.
Instead of trying to relentlessly push your product or service onto and into the market, this will continue your focus on the potential customer and thereby make it easier to build your business based on the customer you are serving.
Profile Characteristics
It is vital you understand the following aspects about your end-user in order to create a description of a narrowly defined subset of end-users with similar characteristics and needs.
Don’t forget, nor be afraid, to go out and speak to real potential customers. Do good, direct customer research now and it will pay off later. You might feel that not all of them are relevant for your situation but err on the side of getting too much information rather than too little. In cases like gender, understand the percentage split between male and female.
The list of what you should know about your segment is not comprehensive nor is it customized to your situation. Use this as a guideline and modify to fit your situation. Look especially for characteristics that would make this end user unique and differentiate them from non-target users.
- gender
- age range (or generation);
- income range;
- what motivates them;
- geographic area;
- where they live (urban, suburban, rural, nomad etc.);
- where they work;
- education/degrees;
- what they fear most;
- who their hero is;
- where they go on vacation;
- where they go out for dinner;
- what newspapers they read;
- what websites they visit;
- what TV shows they watch;
- why they are buying this product (savings, image, peer pressure, productivity);
- what makes them special and identifiable;
- what their story is.
1.4. Calculate the Total Addressable Market for the Beachhead Market
In this step you will use the demographics from Step 3 to quantify the size of your beachhead market. Once this is known, you can then determine if it’s the appropriate size.
If the market is too small, there is not enough opportunity to support a business and you have to rethink whether this is an appropriate market. More likely, though, the market segment will be too big, which will help you see further segmentation is needed to identify a more appropriately sized beachhead market. Then again, if you find the market size is appropriate for your beachhead market, you move forward.
Your chosen beachhead market’s TAM size is the anual revenue your business would earn if it had 100% market share for that market. You will modify this as time goes on, but it is wise to be thinking about this point and develop at least a rough market size to know you are heading in the right general direction.
Bottom-up Analysis
First, find out how many customers are out there—often called “counting noses” because you have to get very specific about customers. This is done with primary market research techniques combined with some secondary market research, but dominated by the former.
- Talk to as many people as possible in your end-user profile group. Find out from them how you can estimate the size.
- If it is a B2B business, find out how many there are in a few representative companies.
- Then, determine the average density of your end-users in companies in your targeted area. This ratio (end users per 1,000 employees, or end users per $1M in revenue, or end users per product produced, or whatever is most appropriate in your situation) is an important metric that we can then extrapolate to the other companies, and build up your estimate in that way.
- Collect and analyze source data (customer lists, trade associations, other sources of customer information) for things like lists of specific companies in the sector you are targeting. In the B2B example above, you can then estimate how many end users for each company name on the list. Company can be replaced with hospital, high school, region, fan club, or whatever is the most appropriate organizational unit for your project.
- Make an estimate of how many potential users there are in the market. This is the first number that you need to know.
- Next, come up with a valid range of how much revenue could be generated from an average single-target end user that fits your profile in the previous step. This is the amount of money they would spend in one year. If they buy your product which costs $100 once every five years, then the annual revenue for this is $100/5 years = $20/year. The more primary market research you can get to build the ratio for this number as well as the annual revenue per user (which can also be a range), the better.
- Now calculate the bottom-up value of your TAM (number of customers × revenue per customer).
- Estimate the CAGR (compound annual growth rate). In this process it is also helpful to figure out how much the market seems to be growing or shrinking. If you can estimate an annual growth rate, this is very helpful. If the growth rate is negative, it is important to understand why and where this money (that is decreasing the market size) is going.
Top-down Analysis
Use market analysis reports and other secondary market research to determine the top-down estimation of your total addressable market:
- Collect and analyze market reports. This could include demographic reports, trade group membership information, etc.
- Define how many end-users are in the market.
- Narrow down these end-users based on various criteria, resulting in an inverted pyramid.
- Determine how many end-users are in your beachhead market (the bottom-most, smallest level of the pyramid, containing all end users who meet your End User Profile).
- Know the budgets of the potential customers you have identified.
- Identity how much they are spending today to accomplish what your product does.
- Determine how much they pay for other products that solve this same problem or offer this same benefit.
- Add up how much value or cost saving your product creates for them.
- Calculate the top-down value of your TAM based on the above data.
Review Key TAM Drivers
As a general rule, the TAM size should be between $5M and $100M. However, there are a few drivers that you should investigate, to make sure you’ve chosen a good TAM:
- Estimate what your gross margins will be in this market. The TAM number represents revenue. So, a $10M TAM with 90% gross margins (e.g. software) is much more attractive than a $10M TAM with low margins (e.g. many energy markets).
- Estimate how quickly you can dominate the market. If you can achieve dominant market share (i.e., you become the standard and have market penetration of greater than 25%) in a year, this makes a TAM much more attractive than one that has slow product turnover and will take 10 years to achieve significant market penetration.
- Estimate what are the odds that you can achieve dominant market share, or will it be a battle with others where you will likely end up splitting the market? If the odds are high that you will dominate the market, because you have very strong critical IP or there are networking effects where the winner takes all, this is much more attractive than a market where you have neither of these.
2. What Can You Do for Your Customer?
2.1. Profile the Persona for the Beachhead Market
In this step you will describe a persona (a detailed description of one potential, real end user). The persona ensures that everyone is unambiguously focused on the same target and you are focused on the customer (not your wants) and what will make them more successful. This will make the customer very real to the team.
If prepared well and displayed conspicuously, the persona will serve as a constant and fresh reminder to you and your team. It is important to review it regulary. Print it out and, put it on wall everyone can’t help but see it. A paying—or monetizable—customer is the most important element for any business.
This is also one of the most fun and unifying steps in the DE Toolbox. It makes your target customer tangible so that all members of the founding team, and all employees, have absolute clarity and focus on the same goal of making their target customer successful and happy. Rather than guessing or arguing internally about what potential customers might want, the persona answers these questions definitively.
Prepare the Process
You are looking to answer this question: “If I had only one end user to represent our end-user profile, who would it be?”
- Collect and analyze sales data, focusing on the most successful customers to date (maybe the 20% of customers generating 80% of the sales). Look at the primary market research you have already done, focusing on customers who would pay (not are just interested) in your potential offering.
- Present a synthesis of all the research & findings to your team.
- Present the end-user profile to your team.
- Discuss with your team which end-user would be the best fit for a persona.
- Consider separate personas for each customer type (for two- or multi-sided markets) but start with the end-user because if they don’t use it, there is no value created.
Define the Persona Profile
Now you have to fill in all the details below as specifically as possible. Remember, the persona is a portrait of one specific end user. Do not give ranges (eg. 25–30 years old) but precise information (e.g. 27 years old). The list below contains just some suggestions. You should find those characteristics that make this persona unique as well.
Personal Details
- first and last name
- photo
- personal info (sex, age, education, family, born, raised)
Career Context
- job info (company, position, how many years in the job, training, salary, performance metrics if a B2B case etc.)
- environment (managers, colleagues, challenges)
His/her Story
- likes
- dislikes
- behavior
- socialization
- hobbies/pastimes
- information sources (web sites, blogs, Twitter, RSS etc.)
- industry groups they belong to
- water holes (i.e., where they congregate)
- other relevant info
Purchasing Criteria in Prioritized order
- highest priority criteria (probably what they fear most in the world)
- medium priority criteria (probably what motivates them the most)
- low priority criteria
- irrelevant criteria
Distribute the Persona
The success of a persona relies in using it. Therefore, you must make sure everyone in your company knows what your customer looks like and is empathetic to his needs and pains.
- We have consensus on the persona among the key members in our team.
- The persona is displayed visibly in our office.
- Everyone in our company or startup has an up-to-date copy of the persona.
2.3. Full Life Cycle Use Case
In this step you will describe in detail how your persona determines they have a problem that can be solved (or they now realize there is an opportunity to solve it), finds out about your product, acquires it, uses it, gets value from it, pays for it, and buys more and/or tells others about it.
This is a first pass at defining the process of the customer before they get your product or service, and uses it; but we want you to start thinking about this now. It will be refined as you go on in the process. You will gain additional clarity and alignment throughout your team by detailing the various aspects of the full life cycle use case and further focusing the discussion on what specifically your product will do for your customer… and what your customer will do with it.
Map out the Full Life Cycle Use case
Rather than simply describing how your persona will use your product, also detail how the end user determines they have a need for your product, how they acquire your product and, ultimately, how you will get paid for your product. You will start by mapping out the process from beginning to end for your persona and then check to see if it is consistent with other potential customers as well. The easiest way to start is by mapping out how your persona uses the product once it is acquired. From there, map out the acquisition and post-acquisition support cases, and make sure you end up with clear diagrams or drawings for all of the following.
How will users:
- Determine they have a need/opportunity to do something different, in the first place?
- Find out about your product?
- Analyze your product?
- Acquire your product?
- Install your product?
- Use your product in detail?
- Determine the value gained from your product?
- Pay for your product?
- Receive support for your product?
- Buy more product?
- Spread awareness (hopefully positive) about your product?
2.4. High-Level Product Specification
In this step you will create a visual representation of your product, to ensure that it is focused on your target customer and also that everyone on your team agrees on what the product/offering is. The description must be focused on the benefits of your product created by the features and not just the features.
The customer is really interested in benefits, the features are just a means to this end. Visually laying out your product will allow your team and your potential customers to converge around an understanding of what the product is and removes ambiguities that often arise when this step is skipped. It also begins to clarify how it will benefit your target customers. Staying at a high level, without too many details or a physical prototype, allows for rapid revision without investing too much time and resources too early in the process of creating your new venture. Remember, you are now in inquiry mode, not advocacy mode.
Building a visual representation of the product may well turn out to be harder than you think, but will get everyone on the same page, which will prove extremely valuable going forward. If it is not, then be happy but still document what your product is so you can begin to iterate with your targeted customers.
This brochure with features, function, and benefits to the customer further clarifies your product offering and will be a great complement to the pictures you create.
Create the High-level Product Specifications
At this stage, the product does not have to be built and almost surely should not, because this will incur unnecessary costs and create something that your team is too attached to. Keep it high level and don’t get distracted at this point.
It will not only cost you more if you build at this stage but it will immediately get you distracted, and the team will focus on the wrong things, like the particulars of the technology.
- Create preliminary sketches of the product (diagrams for hardware, or wireframes for software products).
- Get agreement from your team on the sketches.
- Refine the sketches with your team, to the stage where you can show them to a few selected potential customers.
- Share or discuss with potential customers to get further feedback.
- Further refine the sketches based on feedback, to the stage where you can include them in a presentation or brochure about your product.
Create a Product Brochure (printed and/or digital)
Building a brochure helps you see your product from the customer’s point of view and provides a concrete “straw man” to test with your customer. It forces you to see your new venture from your customer’s vantage point, and in their words. It also allows you to validate your ideas and learn if you are on the right track. Often, when entrepreneurs begin to write down features, they become too inwardly focused. Creating a brochure helps to avoid that pitfall.
- Describe various features of your product.
- Explain how these features translate into function.
- Explain why your target customer needs your product, and how it benefits or solves the problem.
- Design a printable or digital (PDF or website) brochure for your product.
2.5. Quantify the Value Proposition
In this step, you will determine how the benefits of your product turn into value that the customer gets out of your product. You will calculate quantitative metrics (in most cases) to show this value to the customer.
The Quantified Value Proposition gives you a concrete understanding of the measurable benefits your product will bring to your target customers— in the dimension that matters most to them and will most motivate them to action. The Quantified Value Proposition is framed by the top priority of the Persona. This is critically important to know what variable you will be measuring and ensure that it aligns with your targeted customer’s interests and not your interests.
Once you have identified this, you then need to understand and map the “as-is” state in a way familiar to the customer, using the full life cycle use case in this dimension. Next, you map out the “possible” state that will result from using your product, clearly indicating where the customer receives value based on the Persona’s top priority.
A visual, one-page diagram is best, because the customer can easily see the Quantified Value Proposition and can show it to others for validation. When done well, this will be of immense value to you throughout the process of launching your business, so extra effort spent to get this optimized is well worth it. Try wherever possible to use the same language as the customer and also get your work reviewed and verified by the target customer.
Define the Quantified Value Proposition
Create a value proposition focused on the criteria you identified as your Persona’s top priority. If their top priority is time to market for producing goods, and your product’s value is that it will lower the cost of production, your value proposition—Our product saves $ XX per month—will not persuade your target customer to buy your product. Your value proposition is not aligned with their highest priority, so purchasing your product will not be a high priority for the target customer, and will quickly be forgotten. If your product also lowers the time to market, you should focus your Quantified Value Proposition on that benefit and do not talk about the cost savings. Keep it simple and focused.
- Verify that the value proposition is aligned with the highest priority in the Persona profile.
- Evaluate the “as-is” state that does not involve use of your product in terms of benefits/costs.
- Evaluate the “possible” state that you are confident will exist when the customer is using your solution, also in terms of benefits/costs.
- Set up a simple comparison between the two above—the difference between them is the Quantified Value Proposition.
- Describe the Quantified Value Proposition in only one sentence.
- Create a supporting diagram showing the “as-is” state as compared to the “possible” state that visually illustrates the value your product has to the customer.
- Make sure you use the words of the customer in your diagram so they can understand that it is customized to them— or at least to their industry.
- Make sure you make the numbers in the “possible” state ones that you are highly confident your product can attain.
2.6. Identify Your Next 10 Customers
In this step, you will identify 10 additional real high-potential customers that fit your end user profile. Hopefully, these real customers are well-represented by the persona. If not, then you will go back and rethink your persona from Step 5. After identifying the real customers, you will make contact to verify and refine your primary market research.
This step dramatically increases confidence that you are on the right path and, more than likely, also helps you refine earlier steps. While it is important to identify and develop a core persona to represent your end users, you must also be sure to identify other potential customers to ensure your product’s success. This will substantially validate that you have identified a scalable opportunity, not just a one-customer solution, and in so doing, increase your credibility to others. It also helps in directly testing every hypothesis built over the past eight steps and have more touchpoints to test future hypotheses going forward.
Identifying the next 10 Customers
In the process of determining the next 10 customers, you are testing to ensure your persona is truly a useful and credible representation of the target customer. If the Persona is a statistical outlier relative to the target customer group, it will not only be a poor source of information, but it will lead you to develop a “one customer” product which the rest your target customer community might not want. While validating the persona, you may also uncover other interesting traits that customers share with the persona, which will allow you to revise the description of the persona to make it stronger. Now:
- Make a list of more than 10 potential customers and include any pertinent information that you have about them from your existing research.
- Verify that the customers are similar to both each other and the Persona. If they are not, revisit the reasons a customer made it to the list of 10, and, the description of the Persona itself. (Do not worry if these change. The nature of the DE Toolbox is to allow you to pivot on paper before money is spent on ill-targeted marketing campaigns, or product build. Better to erase than have to destroy.)
- Contact each of the potential customers on your list and present your Full Life Cycle Use Case, High-Level Product Specification, and Quantified Value Proposition (Steps 6–8). Make sure you’re operating in inquiry mode, not advocacy/sales mode, so that the outcome is useful.
- Note whether the customer’s needs and ideas are in line with what you’ve established so far.
- Focus on validating the hypotheses you have regarding the Persona’s top purchasing priorities.
- Consolidate all the conclusions from the customer meetings and review all the assumptions.
- If a customer validates your hypotheses from the previous steps, now is a good time to ask the customer if they would consider providing a letter of intent to buy your solution, once it is available.
- Decide whether you need to contact additional customers to collect more data.
- Review any assumptions or conclusions from the previous steps.
- Review and refine the Persona, based on the 10 interviews.
3. How Does Your Customer Acquire Your Product?
3.1. Define Your Core
In this step, you will explain why your business can uniquely provide your targeted customers with a solution that others cannot. You need to figure out something that you do that will make you better than anyone else at producing a solution for your customers. This will be your new venture’s eventual crown jewels.
Defining your Core is more inward-looking and less customer research-based than the other steps. You will rely on this internal introspection, combined with external data gathering and analysis. While the process may seem broad and general at first, your end definition of your Core should be concrete and specific like everything else in the 24 steps. Defining your Core is not easy. It cannot stay at an abstract intellectual level. To come up with a tangible answer to this riddle you must integrate many different considerations:
- What the customer wants.
- What assets you have.
- What you really like to do.
- What others outside your company can do.
- What the personal and financial goals of the owners are.
Your Core cannot be changed often like other elements in this process. Once you lock in on it, it must remain fixed over time. If you change it, you do so at your peril as you will often lose whatever advantages that focus provides to what you built.
The Core is something that you will build stronger and stronger over time if you do the job right. That being said, it does happen that Cores change as you learn more about your market, your customers, and your own company assets, but do this very carefully and infrequently, if at all. A great example of a changing Core definition is Honda’s core expertise. They developed making motors, and over time that translated from weed whackers to lawn mowers to mopeds to cars to airplanes and beyond.
The Core is something that allows you to deliver the benefits of Step #8 to your customers with much greater effectiveness than any other competitor. You are looking for that single thing that will make it very difficult if not impossible for the next company that tries to do what you do to achieve the same level of value creation that you will. It could be a very small part of the overall solution, but without it, you don’t have nearly as valuable a solution. What is it that you do better than anyone else?
Typically, startups that think their strength resides in a combination of multiple elements, are very vulnerable to competitors with a strong core.
- Network effect. You can become the standard by achieving so much critical mass in the marketplace that it does not make sense for potential customers to use another product. The company with the most users is the most valuable; hence it is logical for new users to choose that network. As a result, the network becomes even more powerful; it is a positive feedback loop. Examples of businesses that achieved this are eBay (for both buyers and sellers), LinkedIn, Facebook, and Google for Advertisers. MySpace may have had some advantage from a network effect initially, but the company failed to recognize it and did not leverage it as its Core, which helps to explain why Facebook was able to rapidly gain market share to the detriment of MySpace.
- Customer service. You can excel at customer service, and this allows you to retain customers at a very high rate as compared to competitors, and thereby avoid costly churn. It will also allow you to attract and obtain customers in a much more efficient way than others in the market, as your customers are thrilled with their experience with you and become salespeople for you by creating positive word of mouth. Visible examples of this are Zappos, Warby Parker, Nordstrom, Commerce Bank, and at times in its history, IBM. This strategy is so difficult to execute that a competitor is unable to copy and negate your core, but when it works, it can be very effective.
- Lowest cost. You can develop the skills, relationships, processes, volumes financial overhead, and culture to outcompete anyone else in the market on cost and become the long-term low-cost player. This has been a successful Core for Walmart and it is also part of the strategy behind many Asian companies. Often it is not a Core, but rather an entry strategy for companies who then choose to compete on something else. For example, as mentioned above, Honda entered the US market as a low-cost provider of weed whackers, scooters, motorcycles, lawnmowers, and cars; but, eventually they no longer were the low-cost option.
- User experience (UX). You can become the best at developing and continually improving the UX through the company’s emphasis on it. One company (Gemvara) relentlessly focused on this, from the CEO on down, and it resulted in recruiting top talent, prioritization in operational reviews, and a culture where every employee knows that the bar is very high for this area and nothing less than excellence will be accepted. Clearly this has been Apple’s Core as it produces products that leverage the company’s capabilities and commitment to an insanely great user experience.
- Intellectual Property. Its effectiveness as a Core depends heavily on your industry—in medicine and biotech, patents are incredibly important. In other industries, there may be some value, but often patents are insufficient for ensuring business success as they tend to be static while markets are dynamic. Capability to innovate is generally better than a patent— but it is best to have both; however, make sure to focus on capability if you think you have a technical advantage because historically this has been more effective than IP over time.
- Supplier Lock-Up (Typically not a core). You can anticipate the key elements of your solution and lock in vendors on an exclusive or a functionally exclusive arrangement. You can generally request exclusivity in return for meeting agreed-upon milestones and minimum order quantities, especially if the supplier sells its product to a much different market than yours, or if you are buying large volumes from a relatively small supplier.
- Other core (You will specify it in the conclusion area). The above are just a few common examples. The key is that Your Core be clearly defined, and your founding team aligned so that the Core is what the business will continually work to develop, and will always put first when planning and executing any strategy. Your Core is Your Business last defense against the competition.
- No Core Defined Yet. There might be reasons preventing you from defining a clear core. However, this is a dangerous path, and it makes you extremely vulnerable to established competitors or new entrants in your market.
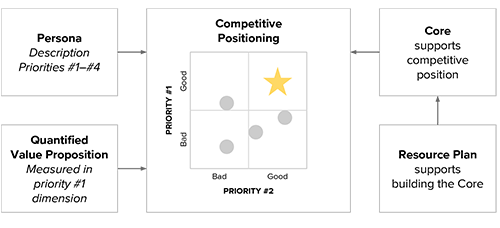
3.2. Chart Your Competitive Position
In this step you will show how well your product meets the Persona’s top two priorities, and how well the Persona’s priorities are met by existing products in comparison to your product. In this step you will also integrate your work from step 10 and iterate to make sure you have a logical core.
Specifically, you will also analyze whether the market opportunity you have chosen fits well with both your Core and your Persona’s priorities. The Competitive Position is where you take your Core and translate it into something that produces real value for the customer, something that they will care deeply about. The Competitive Positioning Chart shows visually how well your Persona’s top two priorities are filled by you versus how well your competition does so.
The goal is to show that your Competitive Position both leverages your Core and that your product satisfies your Persona’s priorities far better than existing or logical future products.
Creating the Chart
Defining your Competitive Position is a quick way to validate your product against your competition, including the customer’s status quo, based on the top two priorities of the Persona. If you are not in the top right of the resulting chart, you should reevaluate your product offering, or at least the way you are presenting it. This will also be a very effective vehicle to communicate your qualitative (not quantitative) value proposition to the target customer audience in a way that should resonate with them.
- Create a two-axis matrix chart.
- On the x-axis, write the number one priority of your persona. On the half closer. On the half of the x-axis closer to the origin, write the “bad state” of this priority (e.g., if the priority is “reliability” then write “low” here). On the other half of the x-axis, write the “good” state of this priority (e.g., “high” for “reliability”).
- On the y-axis, place the number-two priority of your Persona. Write the “bad state” on the half of the y-axis closer to the origin, and the “good state” on the other half of the y-axis.
- Plot your business on the graph, along with those of your competitors (current and future). Also include the customer’s “do nothing” or “status quo” option.
- If you’re positioned in any other position than top-right, reevaluate your product compared to your competition.
- Review this chart with your target customers for feedback. Refine it as needed, until it accurately describes your product and the competition relative to the Persona’s top two priorities.
- Review this chart to make sure that your Core supports your position in the top right corner.
3.3. Determine the Customer’s Decision-Making Unit
In this step you will research and document who are the key people or sources of information that ultimately determines whether or not your target customer will buy your product. There will be a wide array of people involved in the decision to use your product. Some people may play dual roles within their company. Not all will have the same viewpoint or understanding of the situation.
Critical to the decision making process are the end user, the economic buyer, and the advocate. Others, such as those who provide information about their company’s pain points and solution needs, will have varying levels of influence over the decision to buy. Your target customer almost surely has a decision-making group of more than one person. Understanding this group and explicitly mapping out each person’s role and interest is of critical importance not just for the sale, but also much earlier in the process when you are developing the product and all of its attributes.
Identify the Primary Stakeholders in the DMU
To sell your product successfully, you will need to identify all persons who will be involved in the decision to acquire the product for the end user.
Some people will actively approve or block acquisition, while others will present opinions that sway decisions. This process holds true for both B2B and B2C, though B2C may involve fewer people, each of whom could have multiple roles.
- Identify the champion: The champion is the person who wants the customer to purchase the product; this person, may or may not be your end user. Usually there is only one primary champion, but multiple people can advocate for your offering, and provide support to the primary champion. Find that person in a few cases and then build a profile. Though it can vary from situation to situation, understand what the most-common elements are in the profile of champions. Champions can also be referred to as “advocates”.
- Identify end users: These are the persons who will actually use the product to create the value that is described in Step 8, Quantified Value Proposition.
- Identify the primary economic buyer: This is the person from whose budget the money will come to pay for your product. They have the ultimate sign off to release the funds. Often, this is the final approval and everyone else will defer to sign off on spending money to purchase your product.
Identify the Secondary Stakeholders in the DMU
- Identify Primary and Secondary Influencers. These individuals often have a depth of experience in the subject matter, and can influence the rest of the DMU, including the champion and end user. Primary may be consultants, engineering firms, friends and family, industry analysts, journalists. Secondary could likely include media publications, product review sites, industry groups, websites, blogs, and anyone else who the primary stakeholders turns to for information and feedback.
- Identify who has veto power. These individuals have the ability to reject a purchase for any reason. In a B2B environment, this individual can outrank the advocate or end user. It could be a person who enforces standards in the company or a regulatory officer. The person with veto power is less common in a B2C environment.
- Identify the purchasing department. This department handles the logistics of the purchase. They can be another obstacle, as this department often looks to drive prices down, even after the decision to purchase has been made by the primary economic buyer. They can try to disqualify you based on certain purchasing rules that the company has set. In general, they are a link in the chain that you should neutralize, but not sell to.
Create a Visual Map of the DMU
Once you have identified all the above stakeholders, plot the information visually so it is unambiguous (see example below).
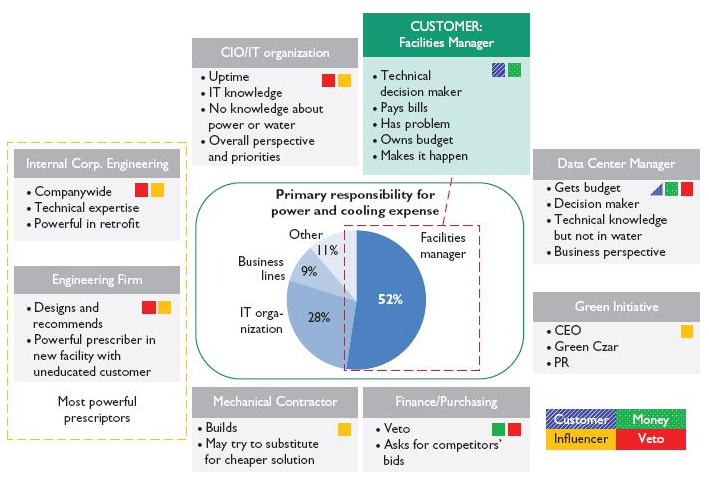
While this is a good example, it leaves off the influencers who are more general like websites, blogs, industry analysts and the like that we mentioned above. You should include these as well.
You can then show this map to your Persona and Next 10 Customers to get feedback quickly, helping you revise the map until it accurately reflects the DMU for your first set of customers. The map also helps communicate the gathered information within your team. The DMU for each customer should be similar, and you should see patterns start to emerge. If you do not, either your customers do not match the Persona, or you have not segmented the market enough.
- Create DMU map.
- Get feedback on the map from Persona or Next 10 Customers.
- Revise DMU map based on feedback.
3.4. Map the Process to Acquire a Paying Customer
In the previous step, we determined “who” needed to make the decision to buy our product. In this step, we will determine “how”. Specifically, in this step you will map out the process by which a customer decides to purchase your product.
In the process of doing this, we will identify the key variables, understand what drives those, and also estimate a very important variable going forward: The length of the sales cycle for your product. You will also identify any budgetary, regulatory, or compliance hurdles that would slow your ability to sell the product. This is also known as mapping the DMP (Decision Making Process), but this description is less precise than the current title, the Customer Aqcuisition Process (CAP).
By creating a map of the process to acquire a paying customer and identifying the fundamental drivers of the length of the sales cycle, you will build the foundation for the Cost of Customer Acquisition calculation.
Key benefits from this exercise will include identifying hidden obstacles that will inhibit your ability to sell your product and get paid, and also to be able to show your potential lenders and/or investors that you understand the customer’s buying process, which for many is a prerequisite to investing in your business.
Mapping the Process
By mapping the process to acquire a paying customer, you will capture more detail about each of these items especially now considering the DMU, as well as map out the internal purchasing mechanisms of your target customer.
Create a table or diagram with the following items from the Full Life Cycle Use Case (Step 6), which will be the backbone of your customer acquisition process:
- How customers will determine they have a need and/or opportunity to move away from their status quo and how to activate customers to feel they have to do something different, i.e., purchase your product;
- How customers will find out about your product;
- How customers will analyze your product;
- How customers will acquire your product;
- How customers will install your product;
- How customers will pay for your product.
Detail the Process Map
For each step in the process, add the following information:
- Who are the key players from the DMU that will be involved in this step? What is their influence on the step or overall process?
- How long will it take to complete this step? Put it in temporal sequence noting any that can run in parallel. Are there any governmental or quasi-governmental regulations that impact this step?
- What are the inputs and outputs of this step?
Detail Budgetary Factors
A key factor in each step is to identify the budgeting/purchasing authority and levels of each individual involved in that component of the process as appropriate. One common limit you will find is that an individual can only purchase items up to a certain dollar amount, such as $5,000, without approval from a more senior person.
Sometimes, this approval comes directly from one decision maker, while at other times, it kicks off a long and involved process with the purchasing department and its regulations.
- Identify budgeting/purchasing limits for each key player in the DMU involved in the process.
- Identify the approval chain.
- Understand the budgeting process.
- Understand whether payment will come from the yearly operating budget or the longer-term capital budget, and even the specific budget.
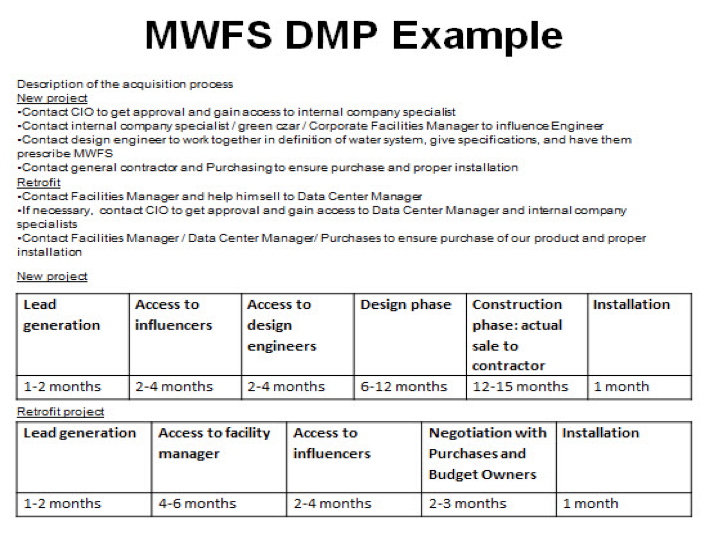
Example
Here is one example that could be helpful but use a format that is appropriate for your situation and do not feel constrained by this example. Note that while this is a good example overall, it does not complete the cycle and clearly document how long it takes to get paid. You need to understand how the cash will flow to your new venture because cash is like oxygen to your new organization. Without it, you die.
4. How Do You Make Money off Your Product?
4.1. Calculate the Total Addressable Market Size for Follow-On Markets
In this step, you will briefly consider which “follow-on” markets you will expand to after dominating your beachhead market, then calculate the size and growth rates of these follow-on markets.
While maintaining a relentless daily focus on your beachhead market, at this point we ask you to pick your head up temporarily to briefly revisit the big picture. We want to make sure that we win a market that is worth winning. This avoids the “Playing Checkers” mentality, which we define as only thinking one step ahead. You want to have the “Playing Chess” mentality— several moves ahead in your market. To do that, in this step we ask you to do a small amount of analysis on what happens if and when you win the beachhead market, from a general standpoint and without a great deal of detail.
- What do you project will be your next markets to be?
- How big do you estimate that they will be?
- What will be your USP (Unique Selling Proposition) in these markets?
- Is it consistent with your core?
- Is it consistent with the skills and assets you will be developing in your beachhead market?
This is simply a check to make sure you are heading in the right direction to build a scalable business and also a reminder of the size and nature of the bigger opportunity. Once this glimpse into your future is done, it is very important that you do not let the lure of the broader market and awesome TAM calculation distract you and your team from the beachhead market.
The broader TAM calculation should galvanize the team to conquer the beachhead market first— and faster— while, keeping the team thinking about the importance of developing and growing the Core business.
Identify the Follow-on Markets and TAM
Use the same general methodology to calculate the TAM for each follow-on market that you did for your beachhead TAM in Step 4. If you want to attract venture capital and/or build a big business, the general rule is that the broader TAM (for 10 or less follow-on markets) plus your beachhead market TAM should add up to over $ 1B. These numbers need not be as precise as the calculation in Step 4 nor should they be. This is a much rougher calculation.
- Identify between 5 and 10 follow-on markets based on the strategy/strategies you choose: Upselling (selling the same customer additional products or application, and using existing sales and distribution channels to sell the new products, thereby leveraging the investment and positive relationship you built with the target customer) or/and Adjacent markets (selling the same basic product to other markets similar to your beachhead. This may require additional features, product refinement, and/or different packaging, marketing communications, or pricing, but you are leveraging the same Core, and building off the expertise and scale developed in the beachhead market).
- Identify the TAM for each follow-on market, based on the principles in Step 4.
- Identify factors to help you estimate the compounded annual growth rate (CAGR) for each of those markets.
4.2. Design a Business Model
In this step you will examine existing models across industries for capturing some of the value your product brings to your customer, and then use the work you have done in other steps to brainstorm an innovative model for your venture. Why spend all this time focusing on innovation related to technology and product design without a commensurate amount of time on innovating with your business model? The track record shows that companies that spend time and effort on innovative business models can see enormous payback.
Once you have established a business model, it is possible but generally not easy to change to a different model. Therefore, choose a business model that distinguishes you from competitors and gives you an advantage over them, because they cannot easily change their business model to match yours.
Detail Key Business Model Factors
When thinking about an appropriate business model for your business, there is no one universally right answer, as it depends on your specific situation. There are few key factors that every entrepreneur should consider:
Customers—understand what the customer will be willing to do. The knowledge you gained from mapping the Decision-Making Unit and Process to Acquire a Paying Customer will be valuable here.
Value creation—understand how much value your product provides to your customer and when.
Value capturing—determine which ways of capturing value match up well. Your Quantified Value Proposition will help here.
Competition—identify what your competition is doing
Distribution—determine if your distribution channel has the right incentives to sell your product.
Determine the Main Type of Business Model
Thinking through some of the common types of business models will help you get a better sense of which is the best fit for you. You may eventually decide on a hybrid business model that includes elements from multiple categories. It is a good idea to look at business models in industries other than your own; such lateral innovation often results in creative, effective business models.
One-time up-front charge plus maintenance. This is the most common business model, where a customer pays a large up-front charge to obtain the product, with the option to secure ongoing upgrades or maintenance of the product for a recurring fee.
Cost plus. In this model, the customer pays a set percentage above the cost of producing the product. This is common in government contracts as well as situations where you and your customer want to share the risk of producing the product.
Hourly Rates. This model also tends to reward activity as opposed to progress, which can be the wrong incentive, but when a project is poorly defined or very dynamic, this might well be the preferred model. A common business model for services firms, it is similar to the Cost plus model, but the rates are set by the market demand rather than costs.
Subscription or leasing. This is a set payment each month or another predetermined and agreed-upon time period. It is a great way to get a recurring revenue stream. There are a number of variations, including annual or multi-year commitment, month-to-month commitment etc.
Licensing your IP to customers and receiving a royalty can result in a very high gross margin (gross margin is the difference between marginal revenue and marginal costs). In addition, if you are licensing your product, you do not have to make big investments in production and distribution capability for a whole product.
Consumables. Another value capture framework that can be advantageous to both the customer and your business is the consumables model. For the customer, the benefit is a low up-front cost, with ongoing costs based on usage, which the customer can usually control.
Upsell with high-margin products. Similar to the consumable business model, the central product is sold at a very low margin, but the overall margin is increased from the sale of very high-margin add-on products. This business model is often used in consumer electronics stores or websites and frequently in new car sales.
Advertising. The ability to attract and retain a desirable demographic can be monetized through third parties who want access to the customers you have attracted. When done properly and on a sufficient scale, this can be a very lucrative model, as Google and others have shown.
Reselling the collected data (or temporary access to it). Somewhat similar to the advertising model, reselling user data requires first attracting end users with a free product, then receiving money from third parties who pay for access to demographic and other information about your users.
Transaction fee. Online retailers often pay or receive a commission for referrals that lead to sales. The model is similar to how credit card companies work, where a percentage of each transaction goes to the credit card company.
Usage-based. A usage-based model— similar to how electric utilities are metered— has been used across various other industries, including cloud computing products today (such as Amazon Web Services).
“Cell phone plan”. This is a predictable, recurring base fee charged in exchange for a certain amount of committed usage, with additional charges, often at much higher marginal rates, if the customer uses more than their allotted amount. The base charge is generally far less per amount of usage than the overage charge.
Parking meter or penalty charges. This is the same business model used by parking meters, credit card companies and (for a while) Blockbuster by charging late fees. Do not take advantage of your customer’s naivete as a central pillar of your business model, as this is a risky strategy.
Microtransactions. A new successful model that came into vogue with online computer games, and is now being tested to try to save newspapers, is microtransactions. In this model, the customer is asked to provide their credit card and then they make very small transactions for digital goods (which have virtually no marginal cost because they are electrons). There are many of them so they can add up.
Shared savings. This business model is often brainstormed, but rarely used because of the complexities in implementing it, despite its conceptual elegance. In this scenario, the customer pays only once they have realized savings or benefits from the product. It is generally not implemented because it is hard to determine how much savings to attribute to the product, especially over a multi-year time period.
Franchise. If an entrepreneur comes up with a good idea and is able to implement but does not have the desire, skills, or money to roll it out, they can use the franchise model and get paid a percentage of sales and/ or receive a large initial startup fee in return for providing the knowledge and brand that has been developed. You can also make money by selling your brand-name products to the franchises to be distributed.
Operating and maintenance. A new business might not want to really sell a product but rather get paid for running a plant or other operation for a fee. While this is similar in some ways to a consulting agreement, the customer has more incentives to control or cut costs, as it will directly impact the customer’s income.
Other. This is nowhere near an exhaustive list of business models, but it will help you think about different ways to capture value for your business.
4.3. Set Your Pricing Framework
In this step you will use your Quantified Value Proposition and business model to determine an appropriate first-pass framework for pricing your product. Now that you have settled on a business model, it is time to start coming up with a pricing strategy. Fine-tuning the strategy can have a huge impact on your earnings.
Pricing is primarily about determining how much value your customer gets from your product, and capturing a fraction of that value back for your business. Costs are irrelevant to determining your pricing structure. You will be able to charge a higher price to early customers as opposed to later customers, but be flexible in offering special, one-time-only discounts to select early testers and lighthouse customers, as they will be far more beneficial to your product’s success than the average early customer.
Basic Pricing Concepts
The pricing framework is extremely important in influencing your profitability, so it is important you price your product correctly. This is your attempt to strike a balance between attracting as much revenue as possible and attracting as many customers as possible.
- Determine how much value your customer receives from your product (using the Quantified Value Proposition), and charge some fraction of that—20% is usually a good starting point, but the percentage depends on the business model. Do NOT determine price based on costs!
- Use the DMU and the process to acquire a paying customer to identify key price points. They provide invaluable information about how your customer’s budget works. Knowing an individual’s purchasing authority limits can help reduce friction in the sales process.
- Understand, from the customer’s perspective, the alternative products available, and how much the customer would pay for each, including the customer’s status quo. Carefully research what other alternatives would achieve similar benefits for the customer, what the prices of those alternatives are, and how much better your solution is.
- Understand how and why different types of customers will pay different amounts, depending on how early or late they are buying relative to other customers. Consider each of the five waves of customers described by Geoffrey Moore in Crossing the Chasm: technological enthusiasts, early adopters, early majority, late majority and laggards.
- Consider flexible pricing for early testers and “lighthouse customers”. These customers may help you create case studies or do on-site seminars where you can promote your product, or otherwise be strong references in the market.
- Consider the fact it’s always easier to drop the price than to raise it. It is best to price high and offer discounts initially, rather than price too low and find you need to raise the price later.
5. How Do You Design and Build Your Product?
5.1. Calculate the Lifetime Value of an Acquired Customer
In this step you will add up the revenue that you can expect to receive from an individual customer, then discount the revenue based on how much it will cost you to repay investors over time.
You will do the math or “unit economics” to discern whether it is a sustainable and attractive business from a microeconomic standpoint. The Lifetime Value of an Acquired Customer (LTV) calculation, along with the Cost of Customer Acquisition (COCA) calculation, will help you determine how profitable your business will be in the beachhead market.
The Lifetime Value of an Acquired Customer calculation is the profit that a new customer will provide on average, discounted to reflect the high cost of acquiring capital that a startup faces. It is important to be realistic, not optimistic, when calculating LTV, and to know the underlying drivers behind LTV so you can work to increase it. You will be comparing the LTV to COCA. An LTV:COCA ratio of 3:1 or higher is what you will be aiming for.
Collect Key Inputs
While the final number will likely be a range and not necessarily correct the first time you do it, it is very important to understand what drives the value of LTV. Here are the key inputs that you will need to understand to estimate the LTV:
- One-time revenue stream, if any. Typically, if there is an up-front charge for your product, it is a one-time source of revenue.
- Recurring revenue streams, if any. Subscription and maintenance fees, as well as repeated purchases of consumables, are all recurring revenues.
- Additional revenue opportunities. If there are opportunities to “upsell” the customer, where the customer purchases additional products with minimal additional effort from your sales team, include these as revenue streams.
- Gross margin for each of your revenue streams. The gross margin is the price of your product minus the production cost of making an individual product. Cost does not include sales and marketing costs (which is factored into the COCA) or overhead costs like R&D or administrative expenses.
- Retention rate. For each recurring revenue stream, this rate is the percentage of customers who continue to pay the recurring fee for the product. Assume, for simplicity, that once the customer has stopped paying a recurring fee, the customer will no longer be receptive to upselling.
- Life of product. For each one-time revenue stream, this is the length of time you expect the product to last before the customer will need to either purchase a replacement or discontinue use of the product.
- Next product purchase rate. For each one-time revenue stream, this rate is the percentage of customers who will buy a replacement product from you when the current product has reached the end of its life.
- Cost of capital rate for your business. Expressed as a yearly rate, this is how much it costs you, in debt or equity, to get money from investors for your business. For a new entrepreneur who lacks a track record and is just getting started, the appropriate number is most likely between 35 and 75 percent per year.
Calculate LTV
The LTV is the Net Present Value of your profits from year 0 through year 5. As a brand-new business, you will calculate the LTV over a five-year period. When projecting more than five years out, the compounded cost of capital for a startup is so high that it negates what value your customer provides you beyond five years. The customer still has value to you beyond five years, but you also have to factor your cost of capital rate into the calculation.
- For each revenue stream, use the gross margin and the retention rate to calculate your profit per customer for the first year your customer buys the product from you (“Year 0”), as well as the subsequent five years. (Use the next product purchase rate instead of the retention rate for the years the customer would be expected to replace the product.)
- Total the profit across all revenue streams for each year.
- Calculate the Present Value at Above Cost of Capital, which discounts the profit to take into account that your investors will need to recoup with interest their investment in your business. The Present Value for year 0 is equal to that year’s profits. To calculate the present value for each year’s profits beyond year 0, use the following formula: Present Value = Profit × (1 − Cost of Capital Rate)t where t = number of years after year 0.
- This is the LTV in dollars per customer.
- Evaluate if your LTV is at least three times bigger than the estimated Cost of Customer Acquisition (COCA; this will be calculated in more detail in a later step). This is a sound rule of thumb for an attractive business, according to venture capitalist David Skok.
Consider Secondary Factors
There are many other secondary factors to consider when determining the Lifetime Value of your customer. Even if your LTV is too low for your product to be viable you should consider whether these elements are correct first; then consider whether you can positively impact your LTV with some adjustments. Make sure you think about all of these:
- The business model. Your choice of business model can greatly affect your LTV and the amount of revenue you earn. Recurring revenue models such as subscription models often increase revenue, but require additional capital from investors up front, and thus have a very high cost of capital. A one-time charge up front can reduce the amount of capital you need to get started, but is not as lucrative on an ongoing basis.
- LTV is about profit, not revenue. Your gross margin and cost of capital rates are integral to determining an accurate LTV. The most common mistake entrepreneurs make on LTV calculations is they simply tally up the revenue streams; but it is the profit that matters.
- Overhead costs aren’t negligible. To simplify the LTV calculation, overhead is excluded; but to account for this, the LTV must be substantially higher than the COCA. These overhead costs, which may include R&D and administrative expenses, are not included when determining the gross margin of a product.
- Gross margins make a big difference. Wrapping your lower-margin core product with high-margin add-on products will substantially help your LTV.
- Retention rates are very important. The longer you can keep a customer, the better your LTV becomes. This is one of a few levers you can easily control to improve the profitability of your business. A small increase in customer retention rates will mean significant improvements in your cumulative profits.
- Finding additional real upselling opportunities can be very attractive. Upselling additional products to your customer can significantly improve your profit. Make sure to drive upselling based on the needs of your Persona, not just to improve your numbers. Companies that over-upsell can lose track of what value they are creating for their customer and also lose the trust and confidence of the customer.
5.2. Map the Sales Process
In this step you will develop short-term, medium-term, and long-term sales strategies for your product. Understanding the details of customer acquisition will make clear to you the drivers of costs so that you will know over time how to make the sales process shorter and more cost-effective.
Mapping the sales process is a thoughtful first pass at how you will enter the market, refine your sales strategy over time, and ultimately establish an inexpensive long-term strategy for customer acquisition. The sales process includes creating awareness, educating the customer, and handling and processing the sale. The sales process drives the COCA, one of the variables—along with the Lifetime Value of an Acquired Customer—that shows your business’s profitability.
Answer Key Questions
To develop this short-term, medium-term, and long-term sales strategy, you must understand which sales channels you will use and how your use of sales channels will change over time. Think of the following key questions:
- How does your target customer become aware that they have a problem or an opportunity?
- How will the target customer learn that there is a solution to this problem they have, or learn there is the opportunity they did not previously know about?
- Once the target customer knows about your business, what is the education process that allows them to make a well-informed analysis about whether to purchase your product?
- How do you make the sale?
- How do you collect the money?
Create the Sales Map
Create a table with two columns (customer segment / sales strategy) and three rows (short term / medium term / long term). Populate it with information on the sales process collected in the previous step:
- What are your short term sales strategies for which customer segment?
- What are your medium term sales strategies for which customer segment?
- What are your long term sales strategies for which customer segment?
- Vet the final sales process map with experienced professionals in the industry
5.3. Calculate the Cost of Customer Acquisition
In this step you will determine how much it costs to acquire a customer over the short term, medium term, and long term, based on your sales process. Entrepreneurs are highly optimistic, but this almost always blinds them to the real costs of customer acquisition. It is essential that you do realistic calculations and then make appropriate adjustments over time.
Caution: The Cost of Customer Acquisition (COCA) is an extremely important metric and can be difficult at first to understand and calculate. This step explains the COCA in detail, but you will need to pay close attention to the details to calculate it correctly. It requires a significant amount of effort and systematic thought. Do not skip or skim this step because getting COCA right is both critical and challenging.
Calculate COCA
First-time entrepreneurs are always tempted to do a bottom-up calculation of COCA, however this method is not accurate. A completely accurate estimate of the cost to acquire one new customer is hard to project. There are situations where the real COCA is 10–20 times the bottom-up calculation. That’s why a top-down calculation will provide more realistic expectations.
- Choose a period of time relevant for your business model, in which the customer will realize the value proposition from your product. If in doubt, use year 1, years 2 and 3, and years 4 and 5 as your three time periods.
- Enlist an experienced person to help develop budget projections, and be sure to understand how adjusting costs affects the profitability of your business.
- Calculate all your sales and marketing expenditures over a period of time. Be sure to include costs for all the key items in your sales and marketing plan: sales reps, auto, travel and entertainment, phone, Internet, demo units, technical sales support, website development, consultants, trade shows, real estate, administrative support, computers, and so on. Also calculate the cost in time that the executives on the team spend on sales as these are very real and expensive costs.
- Tabulate your aggregate sales and marketing expenses (TMSE) over a period of time, and divide it by the period of time to get to TMSE(t).
- If a sizeable portion of your TMSE(t) is the cost of retention of existing customers, rather than acquiring new customers, subtract this from the Substract retention cost from TMSE(t). We will refer to the cost of retention as the Install Base Support Expense over Time, or IBSE(t).
- Determine the number of new customers you will close during each period of time (meaning delivering the product and collecting the money). This is NC(t)—New Customers over Time.
- Calculate COCA for each of the three periods of time using the formula COCA(t)=(TMSE(t)–IBSE(t))/NC(t).
- Plot the three values on a graph where the x-axis is time and the y-axis is COCA for that period. You can also draw a best-fit curve.
Consider ways to reduce COCA
COCA is dynamic, and will almost always start at a very high point (i.e., well above the final COCA and likely higher than the LTV) because you need to first create the market. Your organization will seek ways to reduce these costs to make the business much more attractive. Think about some of the common ways this can be done:
- While very powerful, use direct sales judiciously as it is very expensive. As an alternative, consider investing instead in technological enablers, from telemarketing to having an effective web presence to engaging through social media in order to decrease costs as much as possible.
- Automate as much as possible, even if it requires significant investments. If you can, promote your product through sites where there are big networks and opportunities to make your message go viral, or automate your marketing by creating incentive schemes for your users similar to Avon or Groupon.
- Improve conversion rates in sales. As you see in the bottom-up calculations, there is a huge cost associated with chasing deals that you don’t close. Getting higher conversion rates on leads opens up the funnel so more deals get through, increasing your revenue and decreasing your COCA.
- Decrease the cost of leads and improve the quality of leads by incorporating tools and techniques into your sales process that increase the quality of your leads, and paying attention to where your leads are coming from. This will improve your conversion rates.
- Speed through the sales funnel. By focusing on the speed at which prospects are moving through the sales cycle, you can decrease the sales cycle, which will have a dramatic positive effect on reducing the COCA.
- Choose your business model with COCA in mind. You can switch the business model (the value capturing part) during the life of your business—for example by switching from an usage-based model to a “cell phone” type of model, where customers paid a fixed amount each month for an agreed-upon type of service, with the flexibility to buy additional service on a usage basis. This can make sales cycle length decreased dramatically.
- Word of mouth, which is the biggest driver of reducing COCA. This tends to dramatically decrease the sales cycle, decrease the customer’s desire to push you for discounts, and bring in well-qualified customers who already are good fits for the product, so salespeople can be much more productive in dealing with them.
- Stay focused on the beachhead market from the earliest steps of this process, and do not get distracted by customers outside of your chosen market. This will help improve word of mouth and also make your sales reps much more productive.
5.4. Identify Key Assumptions
In this step you will determine which assumptions about your business have not been thoroughly tested, and you will rank the top assumptions in order of importance.
Identifying key assumptions is the first part of the process to validate your primary market research by looking for customers to take specific actions, which will happen in the next step. Before the assumptions can be tested, they need to be broken down into their component parts, so that each assumption represents a specific, narrow idea that can be empirically tested in the next step using a single experiment design. Do not worry about how you will design the experiment yet. Focus on breaking out all the key assumptions, because if you skip over an assumption fearing that testing it is difficult, you will neglect a potentially important factor in your business’s health.
Identify and prioritize assumptions
Until you have tested your business assumptions and you have shown you will take a specified action, there is too much of a leap of faith for our disciplined entrepreneurial approach. Actions speak louder than words. Those of you familiar with lean startup methodology will see similarities to the concept of a “minimum viable product” or MVP. Over the next two steps, you will unpack your assumptions, breaking them down into a prioritized list to test empirically before you launch your “minimum viable business product” (MVBP).
- Review each step of the framework and make a list of the areas in which you have made logical conclusions based on your primary market research.
- Have you correctly identified your Persona’s priorities?
- Will your customer find the value proposition attractive when it comes time for them to make a purchase?
- Will the customer make the time and effort to integrate your product into their workflow?
- Question assumptions related to your gross margin.
- Are your cost targets accurate? If your product is hardware, review the bill of material and carefully analyze the cost of the most important items in the bill of material. If yours is a software development effort, you will do a similar thing, listing the key development challenges, assumptions, and cost items.
- Review the Next 10 Customers list.
- Review the Decision-Making Unit.
- Out of the customers you have already identified, are any of them “lighthouse” customers, where other customers will buy if they do?
- Are any “linchpin” customers, where if they don’t buy, others will not? Are there other linchpin customers who you have not yet identified?
- Most importantly, are the lighthouse and linchpin customers interested in purchasing your product?
5.5. Test Key Assumptions
In this step you will take your list of key assumptions and design empirical tests to validate or refute them. Then, you will perform the empirical tests, moving quickly and efficiently to decrease the risk of your startup.
Testing key assumptions, particularly the most significant assumptions, such as cost targets and interest of lighthouse customers, prepares you well to sell your product because it complements the primary market research–based approach you have already taken. The convergence of your market research with empirical results from your experiments prepares you to put together a first-pass product and sell to customers.
Testing assumptions
Once we have identified the key assumptions, it is often not hard to test them. For instance, to test cost targets, send an informal request for quotation (RFQ) or spec to vendors to see if your cost projections are accurate at the volume you will be purchasing or developing.
Testing customer interest
To test the interest of lighthouse and linchpin customers, see if they will do any of the following:
- Express a strong interest in purchasing
- Agree to a pilot
- Provide a letter of intent
- Put down a deposit
- Prepay for your solution
6. How Do You Scale Your Business?
6.1. Define the Minimum Viable Product
In this step you will integrate your assumptions into a systems test, consisting of the minimal product that a customer will still pay for.
Now, that you are feeling good about your product, you will launch a minimally viable product that a customer will pay for, but keep the functionality as simple as possible so you can minimize risks and also continue to test the assumptions in a scientific manner. You have previously tested individual elements of your business; however, the Minimum Viable Business Product (MVBP) represents a systems test of a product that actually provides value to the customer. The paying customer can use this to start a feedback loop that helps you iterate better versions of the product.
Defining the MVBP
The Lean Startup definition of what a Minimum Viable Product is too limited and does not accurately describe a “product”. The MVBP combines your most important key individual assumptions into one integrated product that can be sold. The MVBP sets you up to test the most important overarching assumption that integrates the rest—that customers will pay for your product.
There are three core elements necessary to have a Minimum Viable Business Product. All three must be present for this step to be successfully completed (for business models relying on different types of customers, these conditions may be satisfied by either type, as long as the business model still makes sense):
- The customer gets value out of use of the product.
- The customer pays for the product.
- The product is sufficient to start the customer feedback loop, where the customer can help you iterate toward an increasingly better product.
6.2. Show That “The Dogs Will Eat the Dog Food”
In this step, you will take your Minimum Viable Business Product (MVBP), put it in front of your target customer, and test whether this integrated system of assumptions will be accepted and paid for by your target customer, thus showing that your individual assumptions when assembled together actually work in the real world.
You should demonstrate quantitatively that customers will pay for your MVBP (the price is not relevant at this point), and you should also develop metrics that indicate the level of word of mouth your MVBP is creating among customers.
Collect and analyze purchasing and WOM data
Even if the dogs do not eat nearly as much dog food as you thought, you can now learn a tremendous amount because you have real data on the MVBP. You are now in an iterative learning feedback loop with your customer, which is where you will start to mine the gold that will make you rich—customer preferences. With today’s tools, there are so many ways to measure if the dogs are eating the dog food, so entrepreneurs should take full advantage of these tools.
- The target customer buys and accepts the product. The initial price of the product is not as important as showing that target customers will pay for the adoption of your product.
- Define metrics to measure how much customers will advocate to others in the TAM about the benefits of your product (the magnitude of the positive word of mouth your product is generating—often referred to as the virality coefficient).
- Monitor these metrics over time (this creates valuable word of mouth that will decrease your Cost of Customer Acquisition).
- Look for trends and understand underlying drivers. Make sure you are intellectually honest and rely on real-world data and not abstract logic.
- Decide whether this new information impacts on the product or business model, and make a list of necessary changes or improvements before moving on to the next steps. If needed, revisit previous steps.
6.3. Develop a Product Plan
In this step, you will revisit your follow-on market TAM and develop a product plan so that your product is not just an island that leads nowhere. You will go beyond the Minimum Viable Business Product (MVBP) to determine which features you will build out for the beachhead market, then you will determine which adjacent markets you will sell to after dominating the beachhead market, and how your product will have to change for each new market.
The Product Plan you will develop in this step builds on the work you have done in the TAM for follow-on markets. When you established your MVBP, you most likely took a number of features and put them on hold to concentrate on the bare minimum feature set required. In the Product Plan, you will select which of these features, based on your Persona’s needs, to incorporate back into the product. There may be features that you thought the Persona would want up front; but as you further developed your ideas of the product and customer, you find they are much less important than other features you did not consider at first. It is important to institute a protocol within the development of your product where you continuously ensure a high level of quality through process and mindset. When new features or functionality are released, even with the best of intentions, it usually takes a while in the marketplace to work the bugs out and refine the product.
Develop the product plan
Establishing a product plan is similar to the step to calculate the broader TAM. The idea is to get you thinking ahead so you raise your sightlines and don’t get too bogged down in your beachhead market, which is only your first step as a business.
- Review and better define your beachhead market. You want to expand from the beachhead. It gives you a long-term vision that keeps you reaching and thinking ahead, especially in the design of your product and organization.
- Decide follow-on markets. Use the “bowling alley” metaphor from step 14, and take into consideration any new information that you’ve discovered and analyzed during this journey.
- Decide how the product will evolve/change to respond to these new markets. Customers in new markets will need new features or ways to use the product—and these should be dictated by your market growth approach, not only by internal technical considerations or constraints.