Three ways coding agents draw a status bar
Contents 9 sections
Four coding agents run in my terminal, and each one used to tell me something different about what it was doing. Claude Code showed context and cost. Codex showed a model name. Antigravity showed a percentage that was wrong. pi showed tokens. Three of them now share one status bar, built once. The fourth cannot join, and working out why taught me more than the code did.
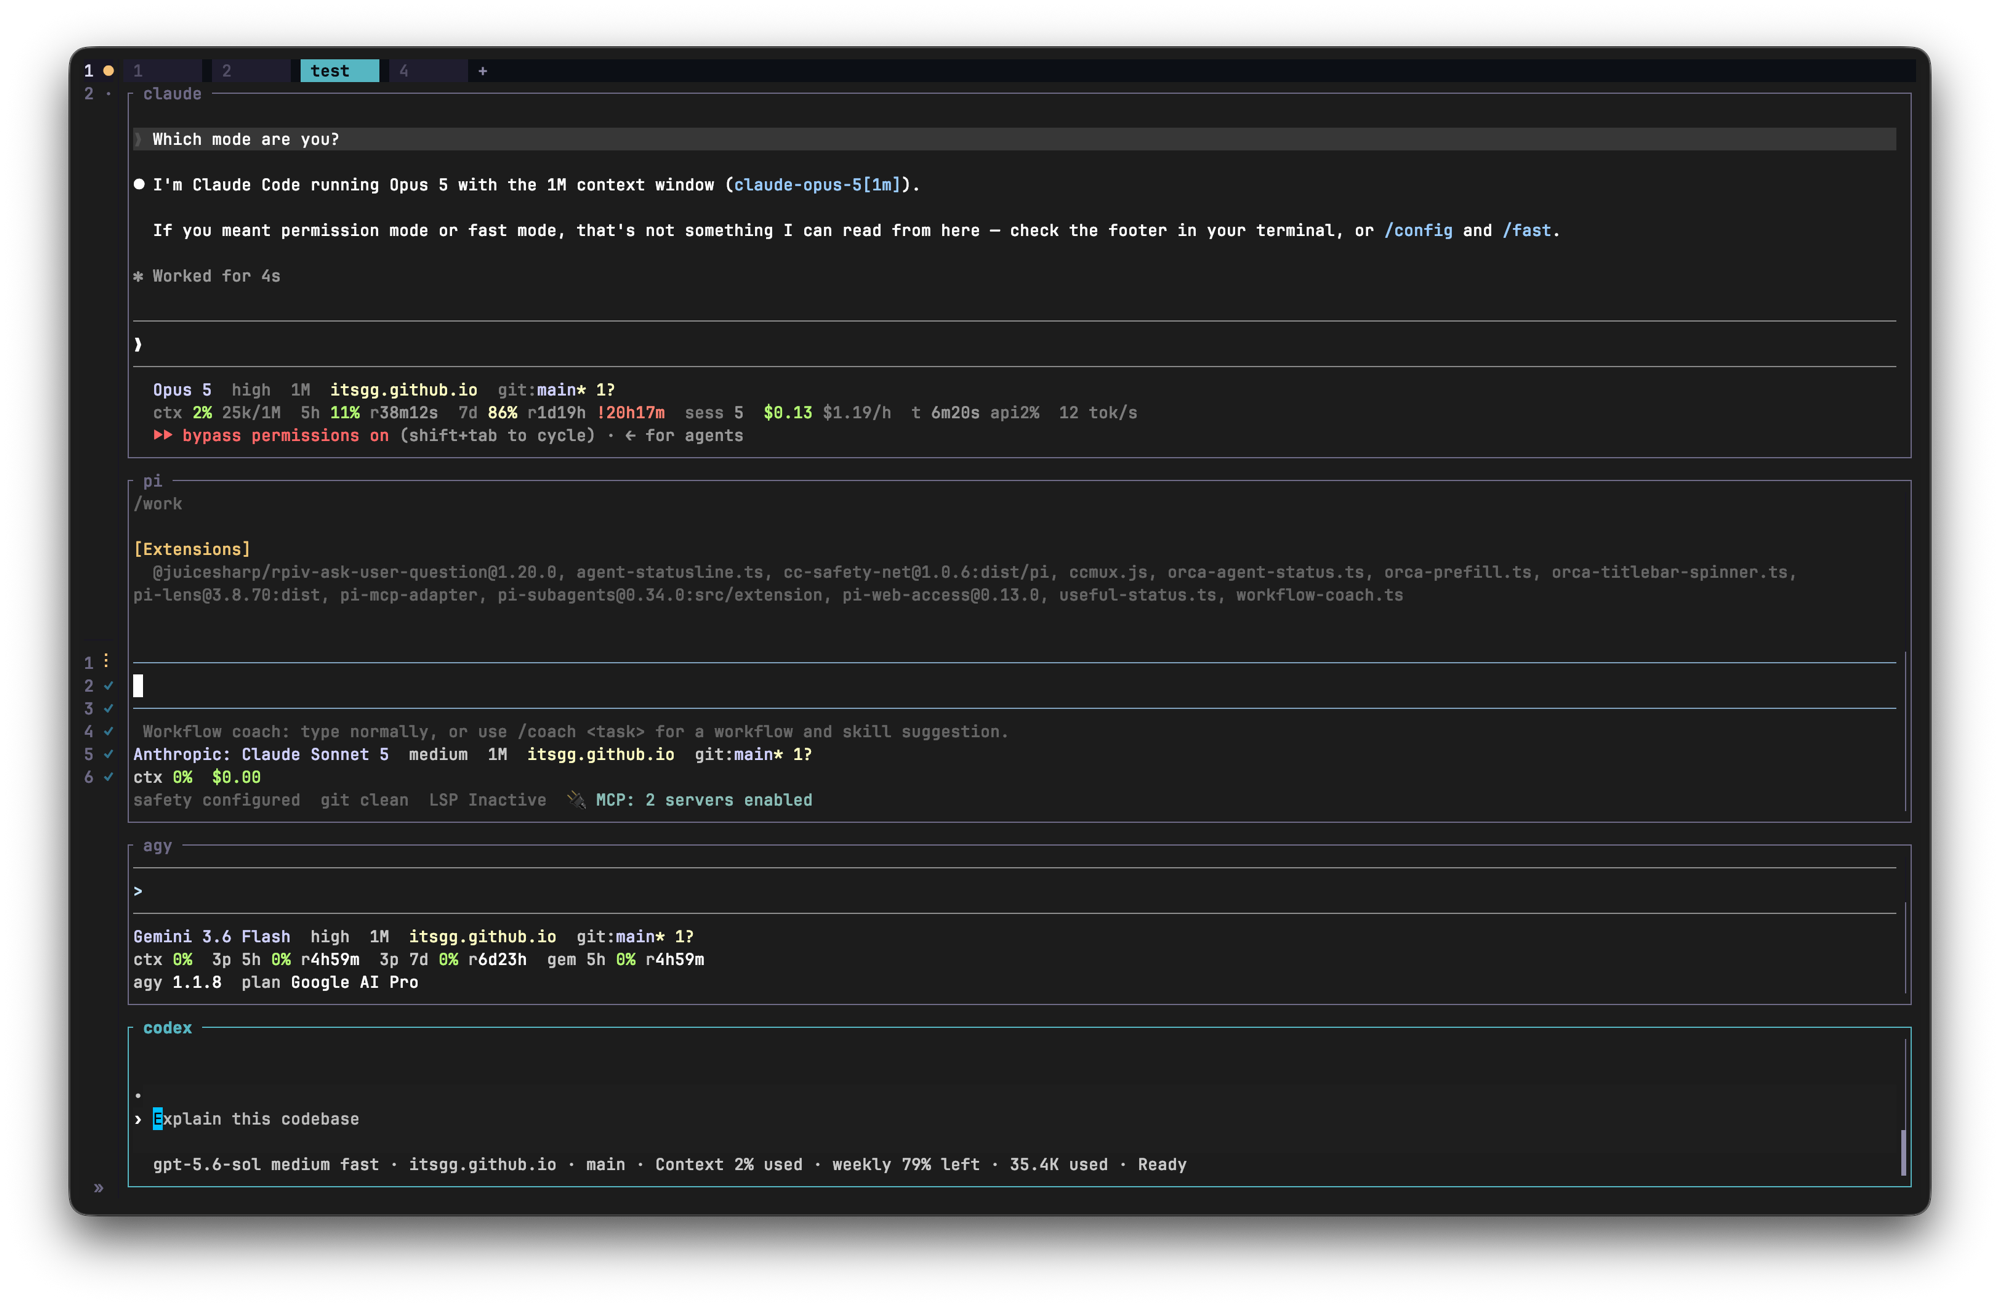
All four at once, in the repo that holds this post. Claude Code, pi and Antigravity draw their bars from the same script. Codex, at the bottom, renders its own built-in items and cannot use it. The red !20h17m in the top pane is the projection: at that rate the weekly quota runs out roughly a day before it resets.
Three mechanisms, not one
The first thing to know is that “customize the status line” means three incompatible things depending on the tool.
Claude Code and Antigravity CLI both run a command. They pipe a JSON blob describing the session to its stdin, read whatever it prints on stdout, and draw that. Anything you can write in any language can render the bar.
Codex CLI does not run a command. Its status line is an ordered list of built-in item identifiers, and you pick which ones appear. There is no hook, no stdin, no way in.
pi has neither. It has an in-process extension API where a TypeScript function owns the footer and returns the lines to draw.
Those three shapes decide everything else. Two of them can share a renderer. One can be bridged into sharing it. One cannot participate at all.
I have only tested these four, and new agents arrive faster than anyone can keep up with. The taxonomy is the part that transfers. Faced with a tool I have not seen, the first question is which of the three it is: does it run a command, does it offer a fixed list of items, or does it expose a plugin API? The answer tells you straight away whether you can share a status bar with it, and roughly how much work that will be.
The payload that became a standard
Claude Code sends its statusline command a JSON object on stdin. The fields that matter are cwd, model, workspace, context_window, cost, and rate_limits. Antigravity sends almost the same object, down to the field names and the exceeds_200k_tokens flag, and it reads the same statusLine.command key out of its settings file.
That is not a coincidence, and it is useful. One script already handles both, so the work that matters is normalizing; rendering is the easy part. I ended up with a small function that absorbs every convention the two share, and per-tool adapters that only handle what is genuinely unique: Claude Code’s vim mode and pull request state, Antigravity’s quota buckets and approval flag. The shared function is most of the code. The pi adapter is six lines.
The boundary is worth stating plainly, because it is the whole design: adapters know about tools, the renderer knows about a normalized struct, and neither knows about the other. A new CLI that copies the Claude Code payload shape needs no code at all.
Codex is the exception
Codex 0.145.0 does have a configurable status line, in ~/.codex/config.toml:
[tui]
status_line = [
  "model-with-reasoning", "project-name", "git-branch", "context-used",
  "five-hour-limit", "weekly-limit", "used-tokens", "run-state", "task-progress",
]
status_line_use_colors = false
Twenty-six item identifiers exist. That list is the ceiling: no session cost, no burn rate, no projection. The nearest thing to lines changed, branch-changes, counts the branch’s committed changes against the default branch, not this session’s. (Codex has since added a cost estimate, for Enterprise workspaces only.) status_line_use_colors = false is what makes it plain text.
One trap cost me a while. Codex warns about an unknown identifier in status_line only after a session has started, and only once, so a typo checked before the first message just makes an item quietly vanish. If something you configured is not showing, suspect the spelling before you suspect the feature.
A command-backed status line for Codex is an open request, not a shipped feature. Do not plan around it.
Bridging an extension API
pi is the interesting case, because an extension can run a command even when the host will not. Its API hands a function the footer and expects lines back, so the extension collects pi’s in-process state, shapes it into the same payload the other two send, spawns the same script, and renders the stdout. One renderer, three tools.
Here it is running in the repo that holds this post:
Anthropic: Claude Sonnet 5  medium  1M  itsgg.github.io  git:main* 1?
ctx 0%  $0.00
safety configured  git clean  LSP Inactive  MCP: 2 servers enabled
The first two lines come from the shared renderer, the same code that draws the Claude Code bar. The third does not: replacing a footer means owning the whole thing, including whatever other extensions have posted there, so the last line is their text passed through untouched. That is also why the two git readings differ. Mine reports main* 1?, one untracked file, which is this post before it was committed. The other extension reports the tracked files, which were clean.
Two things broke on the way, and both are the kind of bug you only find by running it.
ctx.model is a per-event snapshot, not a live handle. My first version captured the context once when the session started, and the model name silently disappeared from the bar. Nothing errored. The fix is to keep the most recent context from any event and read from that.
The second was worse, because it broke something unrelated. My refresh function spawned the renderer on every relevant event, including in non-interactive print mode, where there is no footer to draw into. If building the payload threw an exception, the child’s stdin never closed, so the child blocked on a read forever and held the parent’s event loop open. pi -p answered the question, printed the answer, and then never exited. With the extension loaded it hung for the full 120 seconds I allowed it. With --no-extensions it finished in 5.6 seconds. That comparison is what found it.
Three fixes, all of them cheap: only spawn when a footer actually exists, mark the refresh timer so it cannot hold the loop open, and give the child a watchdog that kills it either way. Anything that spawns a process from inside a TUI needs all three.
What is worth showing
The bar is plain ASCII. No progress bars, no emoji, no nerd fonts, because at a glance across many panes I read text faster than I read a bar of blocks. This is the Claude Code pane from the screenshot above:
Opus 5  high  1M  itsgg.github.io  git:main* 1?
ctx 2% 25k/1M  5h 11% r38m12s  7d 86% r1d19h !20h17m  sess 5  $0.13 $1.19/h  t 6m20s api2%  12 tok/s
Most of that is ordinary. Three parts earn their space.
!20h17m says that at the current burn rate the weekly quota runs out in twenty hours, while the window itself does not reset for another day and nineteen hours. A raw percentage cannot tell you that, and 7d 86% on its own still looks survivable. Where the pace is high but not fatal it renders as a multiplier instead, 1.4x meaning I am spending faster than the window refills but will still make it. Percentages describe the past. This is the only field that describes where I am heading.
sess 5 counts live sessions sharing the same quota, which is more than the four visible in the screenshot. This session’s own cost says nothing about what the others are spending against the same limit. No other tool I found surfaces it.
The third earns its space by not being there. APPROVAL fires when a session is blocked waiting for you to confirm something, and Claude Code has nothing equivalent to report, so the field is simply absent from that pane. Antigravity does send it. It is the highest priority item on the line, so it survives when a narrow terminal drops everything else. With many panes open, “which one is waiting on me” is the most actionable thing a status bar can say.
Where the numbers lie
Antigravity computes its own used_percentage from context_window.total_input_tokens, which is not the size of the prompt. A session with a 29k prompt reported 0.01%. The real composition is in current_usage, so my adapter recomputes from that and keeps the percentage consistent with the token count printed beside it. If my bar and the built-in one disagree, that is why.
The API-time field needs a caveat too. Dividing API duration by wall-clock duration is meant to show whether you or the model is the bottleneck, and I expected a fraction. It came back as 151%. Parallel subagents mean API time can exceed elapsed time, so above 1.0 it now renders as api1.5x and means concurrency, not a bug.
What I have not verified
This ran on one machine, on macOS, on one account, one plan tier per tool, one terminal. Rate limits in particular vary by plan: Codex labels its two windows primary and secondary rather than by duration, and on my account the primary one is the weekly window, so its five-hour-limit item renders nothing at all. You can see that in the screenshot above, where the Codex line shows a weekly figure and no five hour figure. Claude Code sends no rate_limits to API-key users. I derived Codex’s item list by reading strings out of a compiled binary and each payload from a single capture, then confirmed the rendering by driving each TUI in a pseudo-terminal. That is enough to trust it here. It is not enough to promise it holds on your plan.
The activity line is honest about its own limit. Showing running tools and todo progress needs a parseable transcript, and only Claude Code writes one in a format I read. Antigravity keeps conversations in SQLite. pi uses its own schema. So on those two the line carries what the payload volunteers, subagents and counters, and nothing more.
Cost is the other uneven one. Claude Code and pi both report real spend, and pi’s is exact per-token rather than estimated. Antigravity reports none, so those fields simply do not appear. Building every segment to vanish when its field is missing is what lets one config serve tools with very different capabilities.
The piece I would not skip
Capture one real payload before writing a single line of renderer. Point the tool at a three-line script that dumps stdin to a file and prints something harmless, run it once, and read what actually arrived:
#!/bin/bash
in=$(cat)
printf '%s\n' "$in" > /tmp/payload.json
echo "probe ok"
Every wrong assumption I started with died in the first captured payload, and the ones I did not capture are exactly where the bugs were. Documentation told me Antigravity’s context percentage existed. Only the payload told me it was wrong.
Further reading
- Customize your status line: the Claude Code stdin contract, and the de facto shape the others follow
- Antigravity CLI statusline: same mechanism, extra fields worth reading
- openai/codex#17827: the open request for a command-backed Codex status line
- pi ships its extension API reference in the installed package under
docs/extensions.md, which is where the footer and status hooks are documented
New writing by RSS, or on LinkedIn and X.